
By: Uriya Elkayam, Amichai Shulman
Introduction
The Nokod Research Team discovered a data leakage vulnerability in the Microsoft Power BI service. Our team found evidence that tens of thousands of organizations worldwide are affected by this vulnerability, and some of their sensitive data, including employee, customer, business or government data, PHI, and PII, can be accessed anonymously through the Internet.
The vulnerability, which is very easy to exploit, allows attackers to extract information that is not visible in reports generated with the Power BI service but is part of its underlying data model. Potential data leakage scenarios include the ability to access:
- Detailed and potentially confidential data behind the aggregated or anonymized data
- Additional attributes and data assets that were not included in the displayed report
- Additional data records that were filtered out from the display
We reported our findings to the Microsoft Security Response Center (MSRC) on 05/16/2024, and on 05/18/2024, Microsoft confirmed the issue but regarded it as a feature rather than a vulnerability.
Nokod Security created the “Power BI Analyzer”, a simple and free tool to help organizations assess their exposure to this vulnerability. It can be downloaded here.
Technical Details
Description of the Issue
Every Power BI report is built on top of a semantic model. The semantic model represents all the data that could be used for visualization, while the report object defines which data actually becomes visible in the UI and how.
When a report object is shared with other users (explicitly or implicitly by sharing the workspace), all (!) the underlying raw data represented by the semantic model also becomes accessible to those users, including:
- Detailed data records that are used to display aggregations in the report’s UI
- Tables that are included in the semantic model and are not displayed in the report at all (even when these tables are explicitly marked as “hidden” in the model)
- Non-displayed columns of tables not visible in the report’s UI (as details or aggregations, and even when these columns are explicitly marked as “hidden” in the model)
- Detailed data records of tables that are used in the display, even if the display filters out these records.
Not only is the data available to any unauthorized user, but it is also very easy for anyone to figure out what additional data is hidden and view it.
This behavior affects reports that are accessible inside an organization as well as reports that are published to the web.
Exploit details
The execution of a Power BI report requires an API call that extracts the data to be displayed. This is a POST request to the following end-point for reports that are public:
https://wabi-west-europe-f-primary-api.analysis.windows.net/public/reports/querydata
A different API endpoint is used for reports that are only available for users inside the organization:
The payload of the call is a JSON message representing a query in a proprietary Power BI format. A call to this API is made per each visual included in the report. The response includes a JSON representation of the requested data.
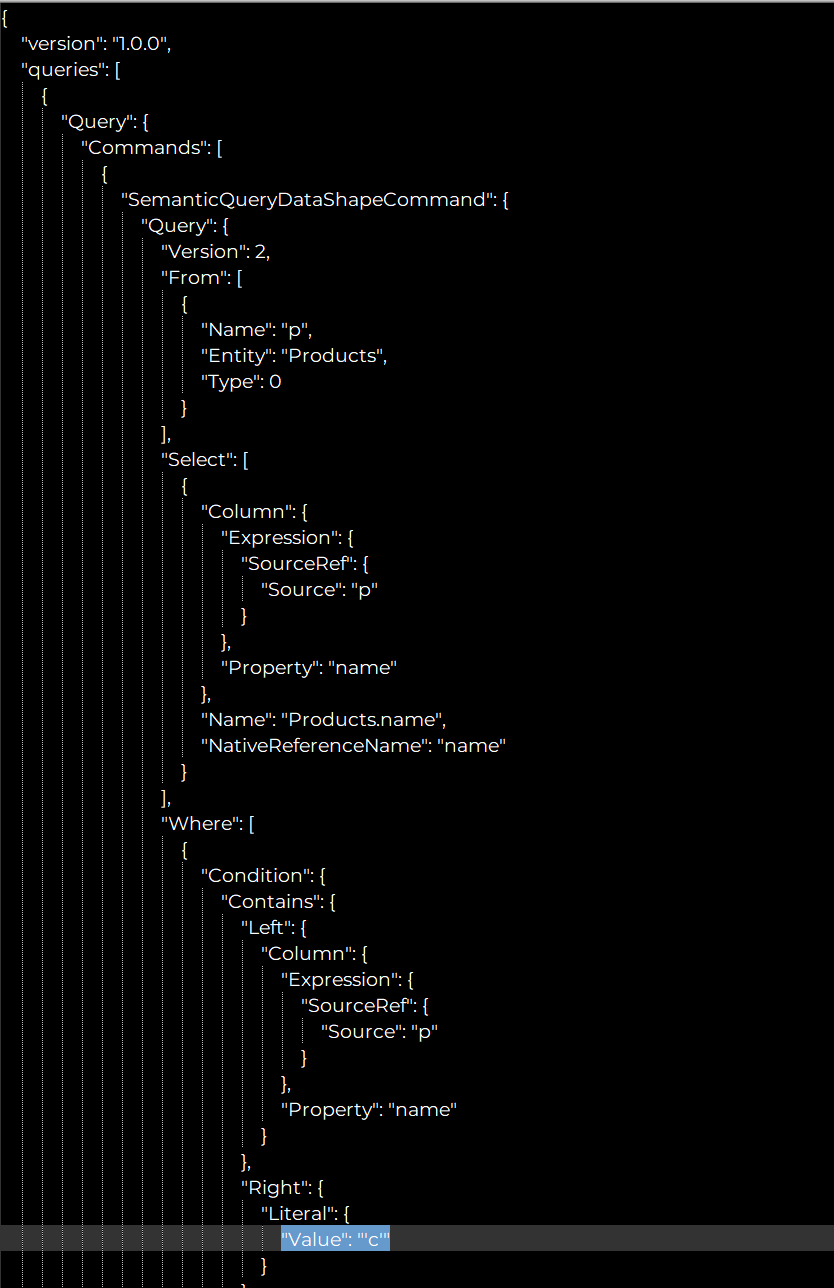
In the first example, the payload includes a query to retrieve the ‘name’ column of the ‘Products’ table. The query restricts the data to products that contain the letter ‘c’ in their name.
A user can also request names of columns and tables to be queried as long as they are part of the underlying semantic model of the report. This is true even when said columns and tables are marked as “hidden” by the owner of the semantic model.
Removing filters and aggregations is very straightforward, as shown in the previous example, and requires no knowledge about the schema of the data source. However, in order to add data that is not included in the visualization, the attacker would need some knowledge about the schema. This can be obtained by another API call that is used for generating a Power BI report. For public reports, the call is a POST request to the following endpoint:
https://wabi-west-europe-f-primary-api.analysis.windows.net/public/reports/conceptualschema
A different endpoint is used for reports that are only available for users in the organization:
https://wabi-west-europe-f-primary-redirect.analysis.windows.net/explore/conceptualschema
The response of this API call includes a representation of the entire semantic model of the report, including those columns and tables that are not used in the visualization, even if those were marked as “hidden” by the creator of the report.
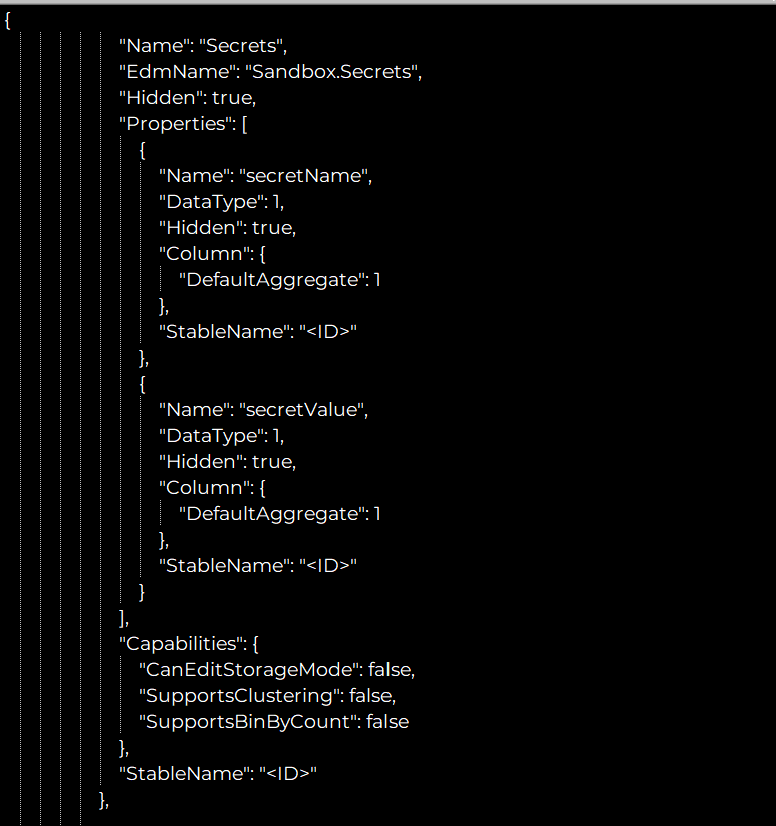
In the following example, we connect a SQL DB to the report and hide the “secrets” table. As you can see, it is still returned by the call to the “conceptualschema” API, and all the columns and values are accessible through the “query” API.
Exposure in the wild
While we are certain that this vulnerability affects almost any organization that shares Power BI reports internally, the more critical concern is for those organizations that publish – intentionally or unintentionally – reports to the web.
Tens of thousands of reports are intentionally made public by organizations to externally share corporate, product, financial, healthcare, government, and other information. We were not surprised to stumble upon several examples from government institutions as well as commercial organizations that have shared anonymized data in the form of graphs and summaries with the public.
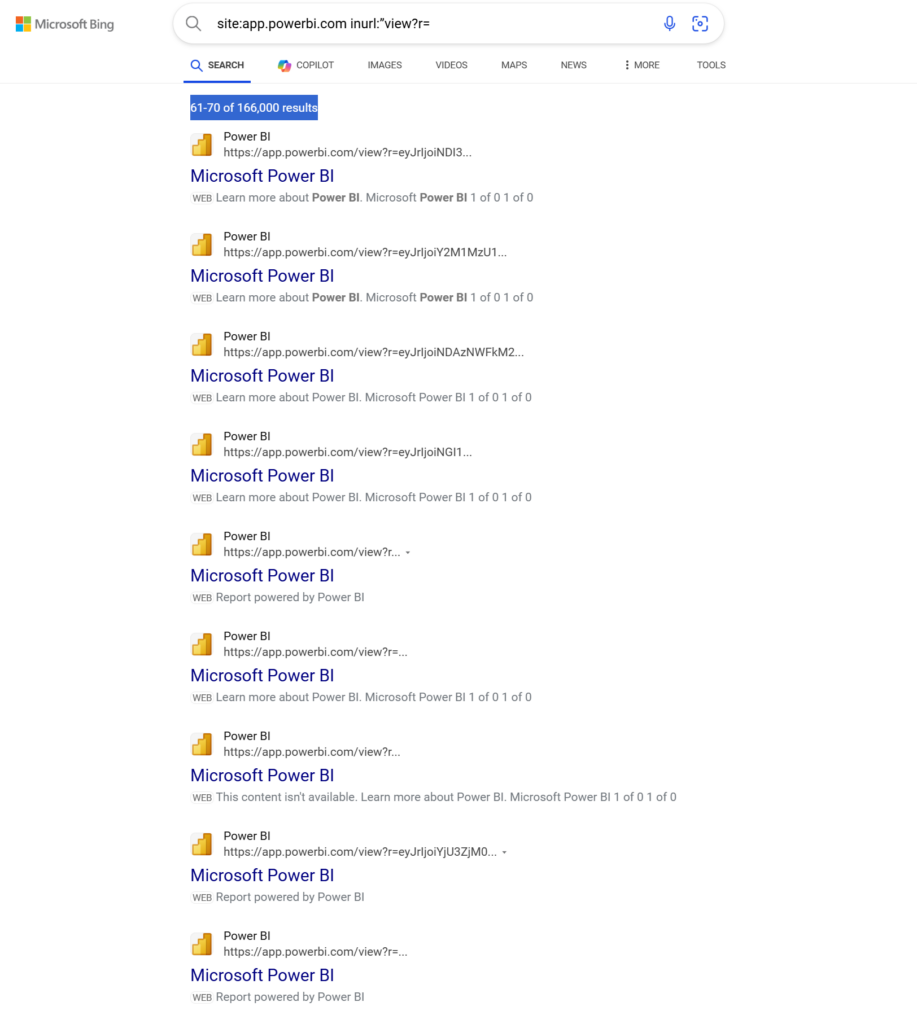
In fact, it is pretty easy to find a large number of Power BI reports published on the web with the help of search engines. Simple search string such as: site:app.powerbi.com inurl:”view?r=” yields literally countless results. Bing for example returned over 160,000 results.
Variations of this search string, such as : site:”https://app.powerbi.com/view?r=” + sales, can yield more focused results. Some of our queries based on this specific search string generated more than 50,000 results.
While many of the results are sample reports created by service providers demonstrating their Power BI skills for customers, numerous results represented actual data from real organizations. Using the simple API calls we showed earlier, it is easy to tell whether a report will expose unintended/sensitive data and then retrieve this information at will.
Applying refined search terms and manual inspection, we quickly detected a few dozen reports that were exposed to this vulnerability, and that allowed for additional sensitive data to be extracted. Again, the fact that during a random manual screening of this huge number of search results we were able to find so many examples of exploitable reports demonstrates the profound seriousness of this risk. Among the organizations that we found to be vulnerable were state government sites that unintentionally expose PHI, universities exposing employee data and municipalities exposing PII.
Remediation
Microsoft’s position is that the behavior we uncovered is a design choice rather than a vulnerability. Hence it is the responsibility of organizations who create and share the reports to create them in a way that does not disclose any sensitive information.
While we disagree with Microsoft’s assessment of this behavior (in particular with respect to “hidden” columns and tables) we have developed these guidelines to help organizations protect their data while creating reports:
- Instead of using “hidden” tables and columns in the semantic model of a report, remove them from the semantic model altogether. While this is simple to achieve for tables, it is a bit tricky though possible for individual columns.
- If you want to display only a subset of an entire data table in the report (e.g. only data of employees from a specific region, only data for a specific set of products, etc.) use a Power Query expression to restrict the “Data Source” you attach to the “Semantic Model”. This way the semantic model does not access the data source directly but only the subset.
- If you show aggregated data, make sure that you only select non-sensitive columns of the underlying data source for the semantic model. If this is not possible for some reason (e.g. aggregation is based on a function of a sensitive column) use a Power Query expression to aggregate the data of the “Data Source”.
Additionally, it is a best practice for organizations to frequently review their Power BI environments for reports that were unintentionally published to the web or simply overshared within the organization. If reports do need to be widely shared, make sure that their semantic model follows the guidelines above.
Free risk assessment tool
In order to assist organizations with an initial assessment of their exposure to this vulnerability Nokod Security created the Power BI Analyzer, a simple Python based tool that scans your Power BI environment for reports that are either published to the web or widely shared in the organization. For these reports, the tool makes an initial assessment of whether a report has more underlying data than exposed in the report.
The tool is Open Source and can be downloaded here.
For further information contact:
Uriya Elkayam: [email protected]
Amichai Shulman: [email protected]
Join Us on Our Journey
Subscribe to Our Newsletter – Stay informed about the latest security trends, product updates, and industry insights. Find a signup form in the sidebar.
Follow Us on LinkedIn – Connect with us on LinkedIn for real-time updates and engaging discussions.